IELTS Academic Writing Task 1 Sample 2
City Spending
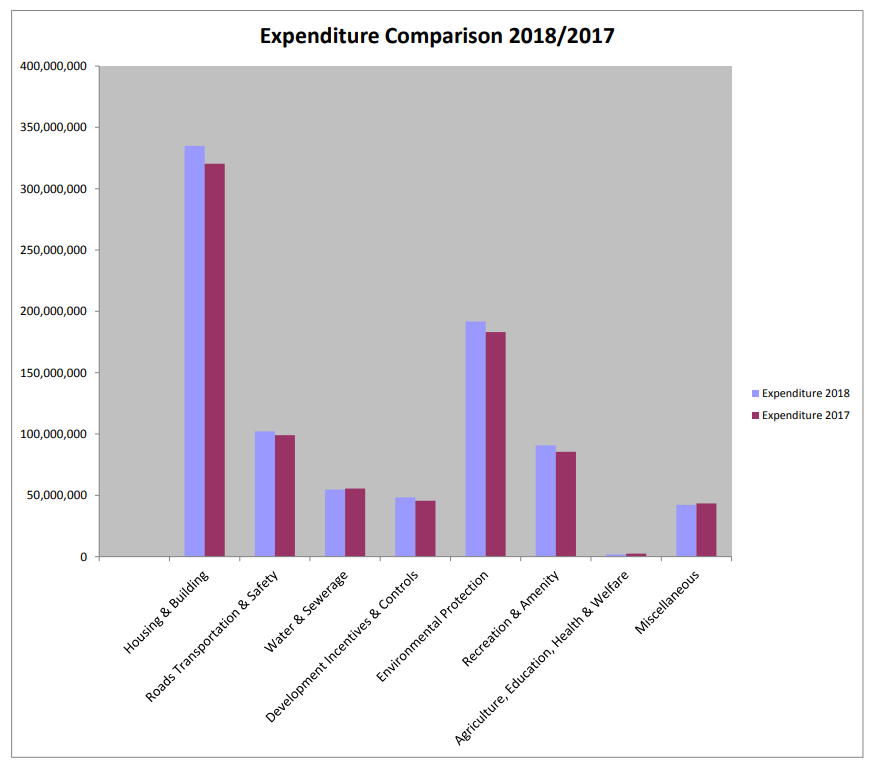
This diagram demonstrates the amount of spending by Dublin City Council in 2018 and 2017. Summarise the main findings in around 150 words.
-
Sample Answer |
|---|
This graph shows the amount of spending by Dublin City Council in 2017 and 2018. The graph identifies eight main areas of spending. Expenditure on housing and building is by far the most significant outlay for the Council in both years. In 2018, investment in this area was 150,000,000 more than the second highest amount for Environmental Protection. In most areas, we see a slight increase in spending in 2018, apart from Water and Sewerage and Agriculture, Education, Health and Welfare. In both of these areas, spending was on a par with the previous year. A minuscule decrease in Miscellaneous spending is the only area where a reduction is recorded between 2017 and 2018. Agriculture, Education, Health and Welfare is the area where the least amount of investment was made, with diminutive figures recorded, compared to Housing and Building. Recreation and Amenity also saw a significant upturn in spending on the previous year. |
-
Analysis |
|---|
COHERENCE AND COHESION
*Taken literally and in isolation, the second highest amount for Environmental Protection is in 2017. |
GRAMMAR
|
LEXICAL RESOURCE Apart from the opening, each subsequent paragraph has a notable vocabulary element, as detailed below. A suggested alternative for “the only area where a reduction is recorded” in paragraph three is “the only area in which a reduction is recorded”. This alternative could also feature in paragraph four.
|